Illustration
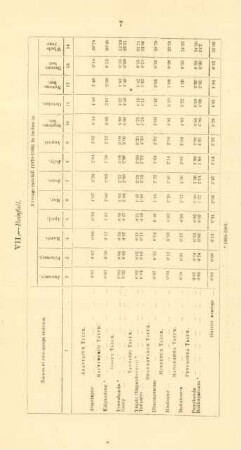
Appendix A.C. Diagram Shewing the Average Daily Rainfall Over the Thames Basin During Each Month from January, 1855 to June, 1866.

- Sprache
-
Englisch
- Erschienen in
-
Report of the Commissioners : presented to both Houses of Parliament by Command of Her Majesty ; [Band 2]
- Erschienen
-
1869
- Letzte Aktualisierung
-
09.04.2025, 13:23 MESZ
Datenpartner
Dieses Objekt wird bereitgestellt von:
Staats- und Universitätsbibliothek Hamburg Carl von Ossietzky. Bei Fragen zum Objekt wenden Sie sich bitte an den Datenpartner.
Staats- und Universitätsbibliothek Hamburg Carl von Ossietzky. Bei Fragen zum Objekt wenden Sie sich bitte an den Datenpartner.
Objekttyp
- Illustration
Entstanden
- 1869
Ähnliche Objekte (12)
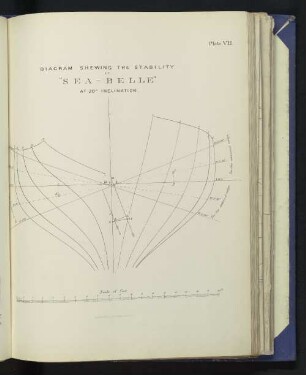
Plate VII. DIAGRAM SHEWING THE STABILITY "SEA-BELLE".

Early Life Exposure to Above Average Rainfall and Adult Mental Health
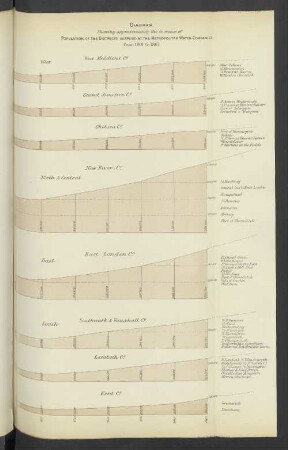
Diagram. Shewing approximatley the increase of Population of the Districts (...) from 1801 to 1861.
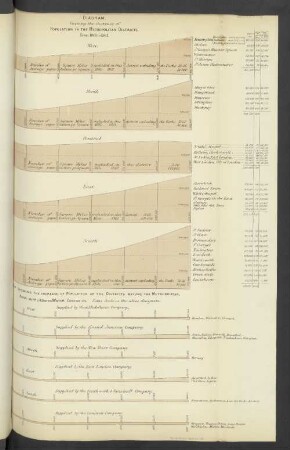
Diagram. Shewing the increase of Population in the Metropolitan Districts from 1801 to 1861.
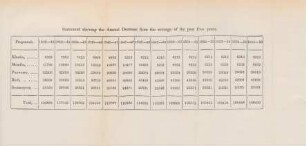
Statement shewing the annual decrease from the average of the past five years
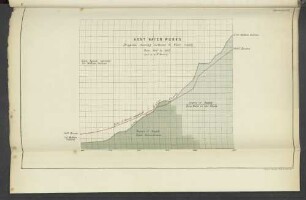
Appendix (S). Kent Water Works. Diagram shewing increase of Water Supply from 1840 to 1867.
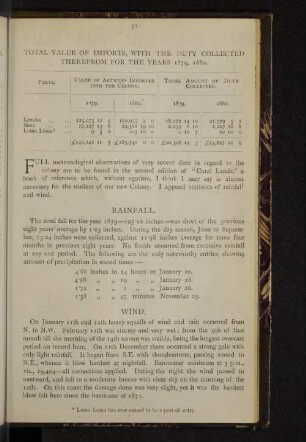
Rainfall.

Appendix L. The River Thames shewing all the Docks of London with the Extensions now in Progress
Long memory, seasonality and time trends in the average monthly rainfall in major cities of Nigeria
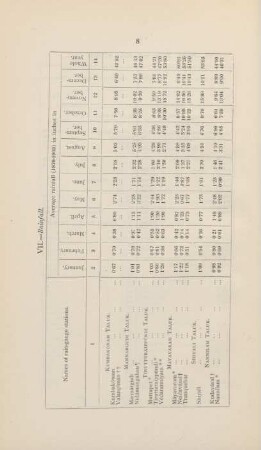
VII. Rainfall
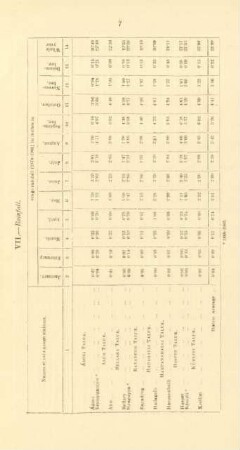
VII. - Rainfall
VII. - Rainfall
Plate VII. DIAGRAM SHEWING THE STABILITY "SEA-BELLE".
Early Life Exposure to Above Average Rainfall and Adult Mental Health
Diagram. Shewing approximatley the increase of Population of the Districts (...) from 1801 to 1861.
Diagram. Shewing the increase of Population in the Metropolitan Districts from 1801 to 1861.
Statement shewing the annual decrease from the average of the past five years
Appendix (S). Kent Water Works. Diagram shewing increase of Water Supply from 1840 to 1867.
Rainfall.
Appendix L. The River Thames shewing all the Docks of London with the Extensions now in Progress
Long memory, seasonality and time trends in the average monthly rainfall in major cities of Nigeria
VII. Rainfall
VII. - Rainfall
VII. - Rainfall
Plate VII. DIAGRAM SHEWING THE STABILITY "SEA-BELLE".
Early Life Exposure to Above Average Rainfall and Adult Mental Health
Diagram. Shewing approximatley the increase of Population of the Districts (...) from 1801 to 1861.
Diagram. Shewing the increase of Population in the Metropolitan Districts from 1801 to 1861.
Statement shewing the annual decrease from the average of the past five years
Appendix (S). Kent Water Works. Diagram shewing increase of Water Supply from 1840 to 1867.
Rainfall.
Appendix L. The River Thames shewing all the Docks of London with the Extensions now in Progress
Long memory, seasonality and time trends in the average monthly rainfall in major cities of Nigeria
VII. Rainfall
VII. - Rainfall