Arbeitspapier
Basic Stata graphics for economics students
This paper provides an introduction to the main types of graph in Stata that economics students might need. It covers univariate discrete and continuous variables, bivariate distributions, some simple time plots and methods of visualising the output from estimating models. It shows a small number of the many options available and includes references to further resources.
- Sprache
-
Englisch
- Erschienen in
-
Series: UCD Centre for Economic Research Working Paper Series ; No. WP18/11
- Klassifikation
-
Wirtschaft
Econometric Software
Data: Tables and Charts
- Thema
-
Stata
graphics
data visualization
- Ereignis
-
Geistige Schöpfung
- (wer)
-
Denny, Kevin
- Ereignis
-
Veröffentlichung
- (wer)
-
University College Dublin, UCD School of Economics
- (wo)
-
Dublin
- (wann)
-
2018
- Handle
- Letzte Aktualisierung
- 10.03.2025, 11:41 MEZ
Datenpartner
Dieses Objekt wird bereitgestellt von:
ZBW - Deutsche Zentralbibliothek für Wirtschaftswissenschaften - Leibniz-Informationszentrum Wirtschaft. Bei Fragen zum Objekt wenden Sie sich bitte an den Datenpartner.
ZBW - Deutsche Zentralbibliothek für Wirtschaftswissenschaften - Leibniz-Informationszentrum Wirtschaft. Bei Fragen zum Objekt wenden Sie sich bitte an den Datenpartner.
Objekttyp
- Arbeitspapier
Beteiligte
- Denny, Kevin
- University College Dublin, UCD School of Economics
Entstanden
- 2018
Ähnliche Objekte (12)

Basic drawing, graphics, and projections
Einführung in STATA
SPSS, PC+ Basics und Graphics : Einf. u. prakt. Beispiele
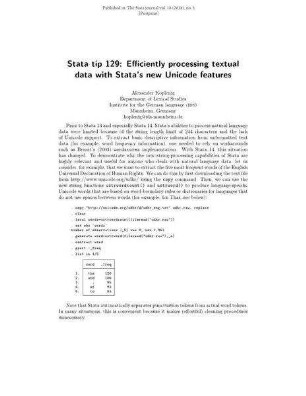
Stata tip 129: efficiently processing textual data with Stata’s new Unicode features

Stata tip 129: efficiently processing textual data with Stata’s new Unicode features
SOEP-spezifische Problemlösungen mit Stata
Implementing intersection bounds in Stata
A practical introduction to Stata

Aria: "Dovunque è stata intesa"
STATA und R: eine Gegenüberstellung

Stata für Umsteiger: ein Einführungskurs
Implementing intersection bounds in Stata
Basic drawing, graphics, and projections
Einführung in STATA
SPSS, PC+ Basics und Graphics : Einf. u. prakt. Beispiele
Stata tip 129: efficiently processing textual data with Stata’s new Unicode features
Stata tip 129: efficiently processing textual data with Stata’s new Unicode features
SOEP-spezifische Problemlösungen mit Stata
Implementing intersection bounds in Stata
A practical introduction to Stata
Aria: "Dovunque è stata intesa"
STATA und R: eine Gegenüberstellung
Stata für Umsteiger: ein Einführungskurs